📈 Your Columbia Market Report for March 2022!
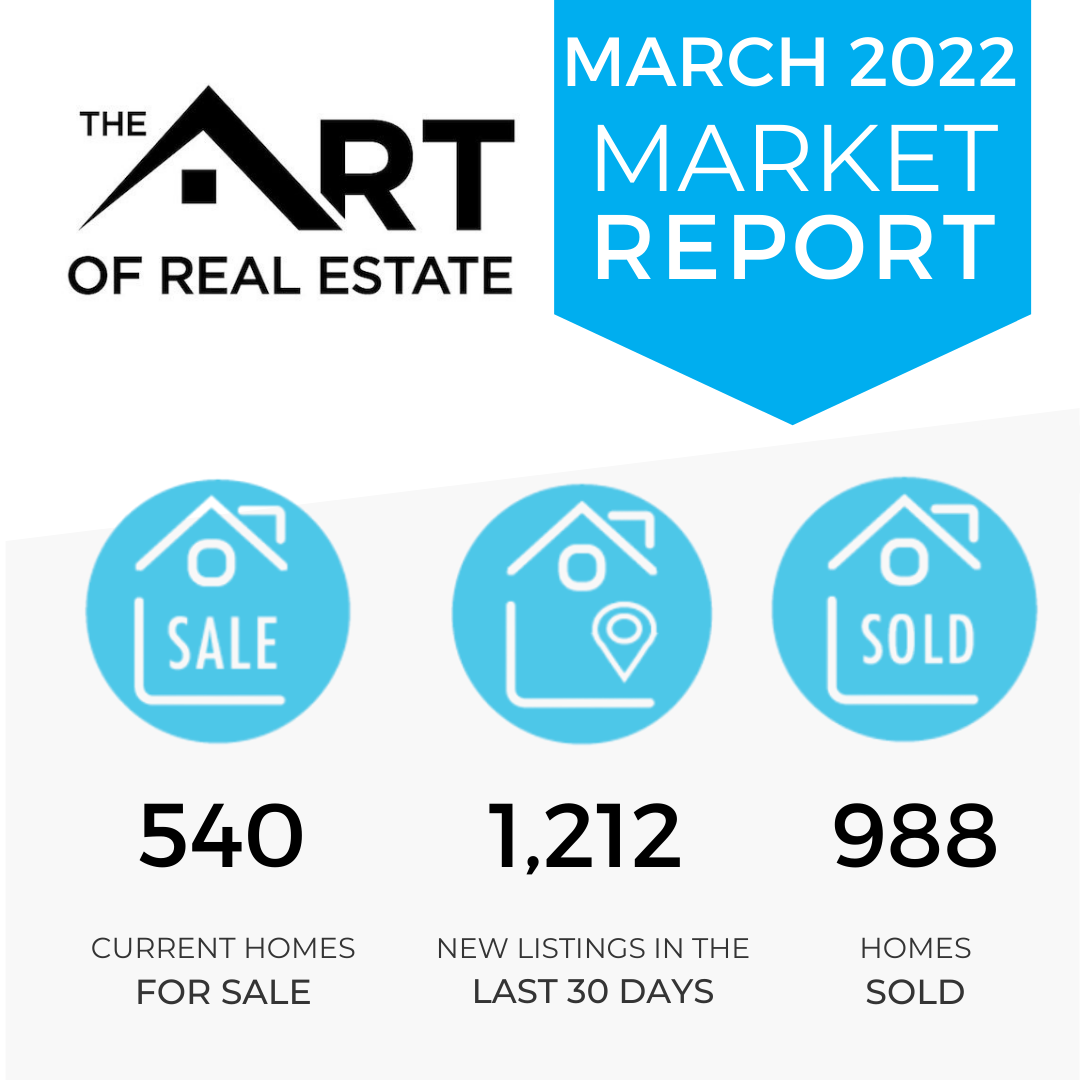
The housing market is complicated, and reading data can be overwhelming. Yet, it's important to be up-to-speed on real estate market trends.
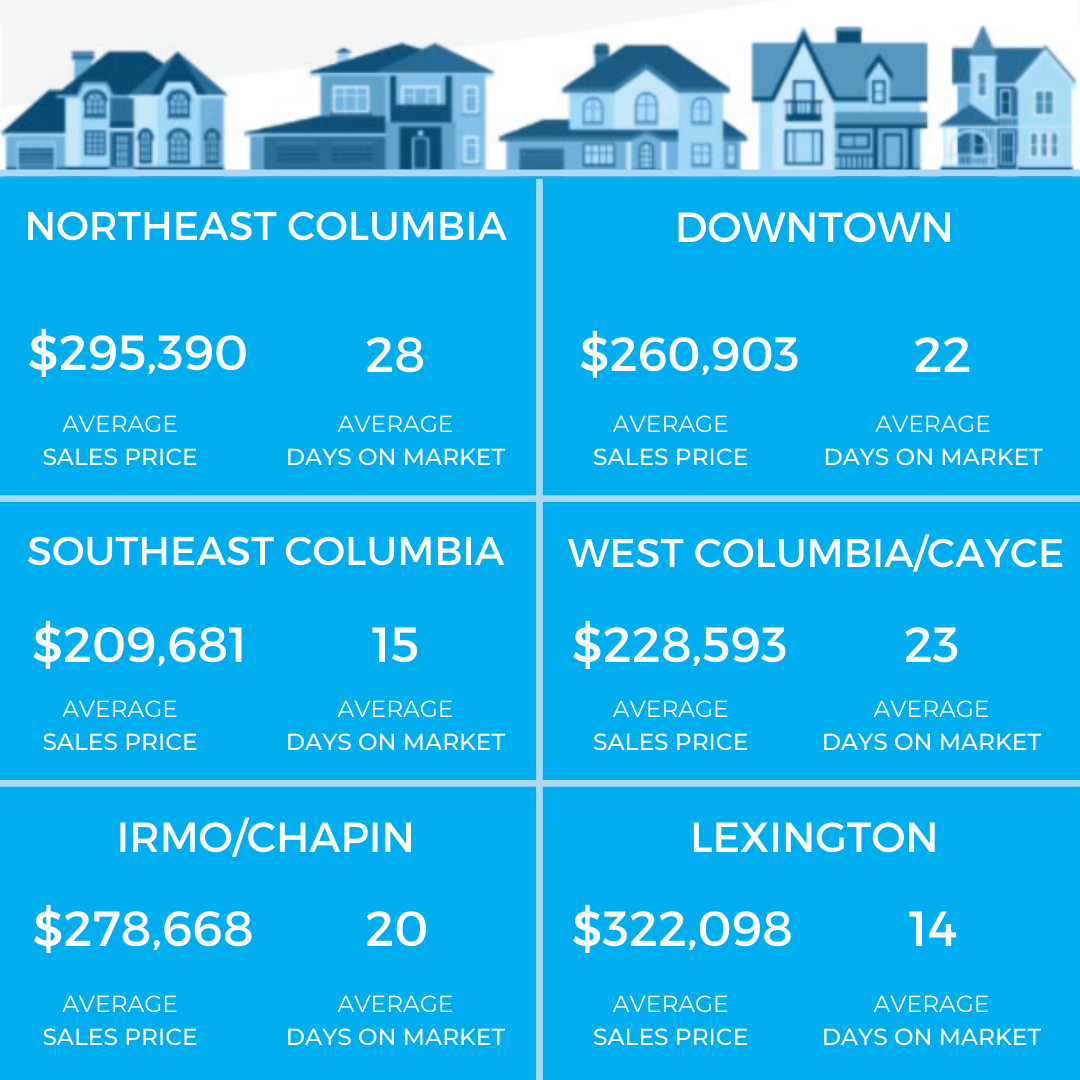
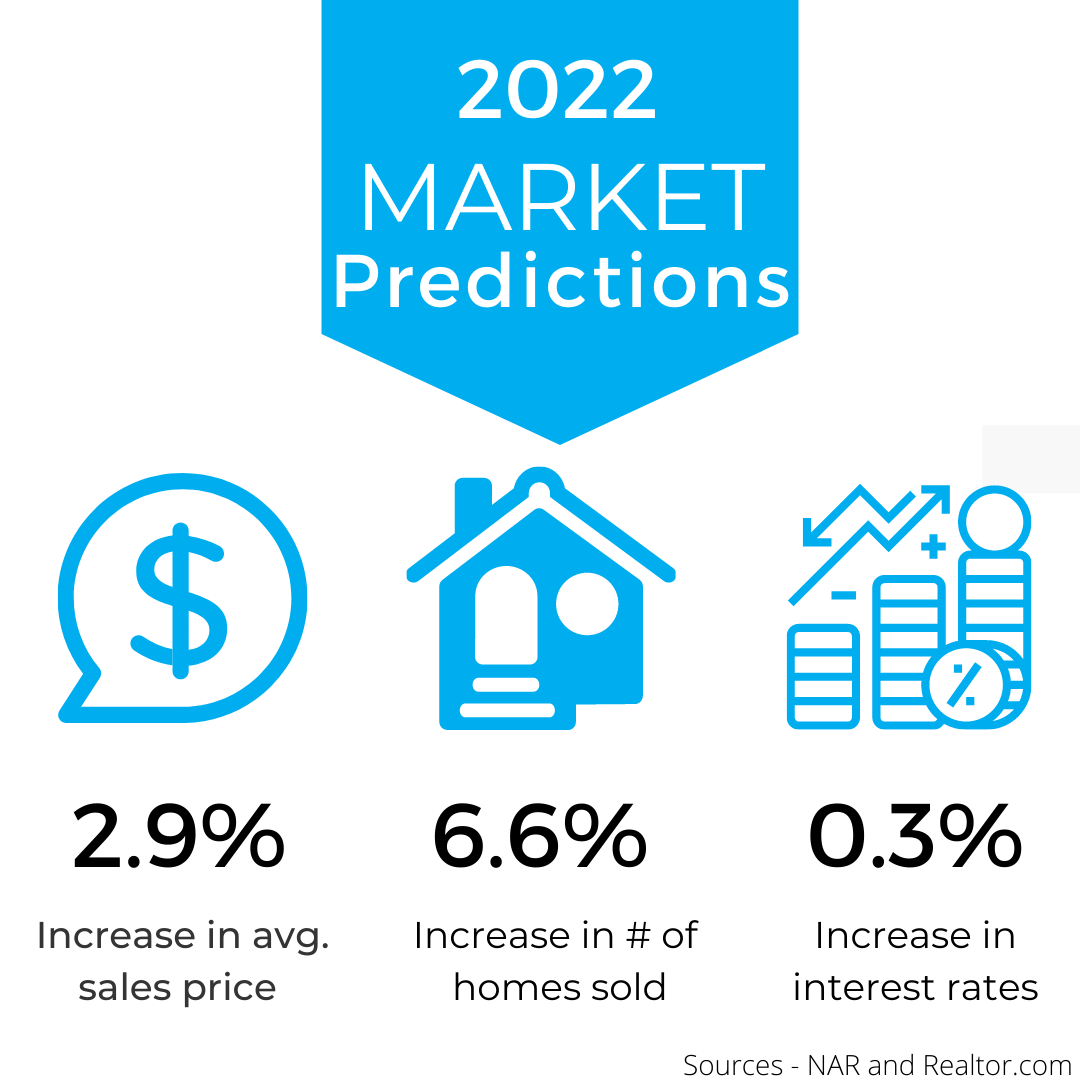
It's why we've gathered key data points and put them into this simple info-graphic. No matter buying, selling or just curious about the market, these stats will benefit you.
Keep scrolling to learn about the average sales price of your area, how long those homes stay on the market + how well the market is performing.


.png?w=1920)

Our Featured Favorites
See how much your home would sell for, today.
We sold 121 Beaver Ridge Drive for $1.8 Million in 1 week.
- Step 1
- Step 2
Thank You!
One of our teammates will be reaching out to you shortly so that you can get the accurate numbers you need.
.png)
.png)
.png)
.png)
